This is the culminating activity of The Grid. It takes place over two to three days so students have the chance to work with other students than their BFF or the randomly assigned partner their evil teacher (me) stuck them with. As with every activity I run, I have the class agenda written out on a white board when students walk through the door. The board usually has one or two objectives for the class that are written with the phrase “We will”. I write them in a “We will…” formate because I consider myself one of the learners in the class. Even after running this activity for several years, I find that this old dog still learns new tricks.
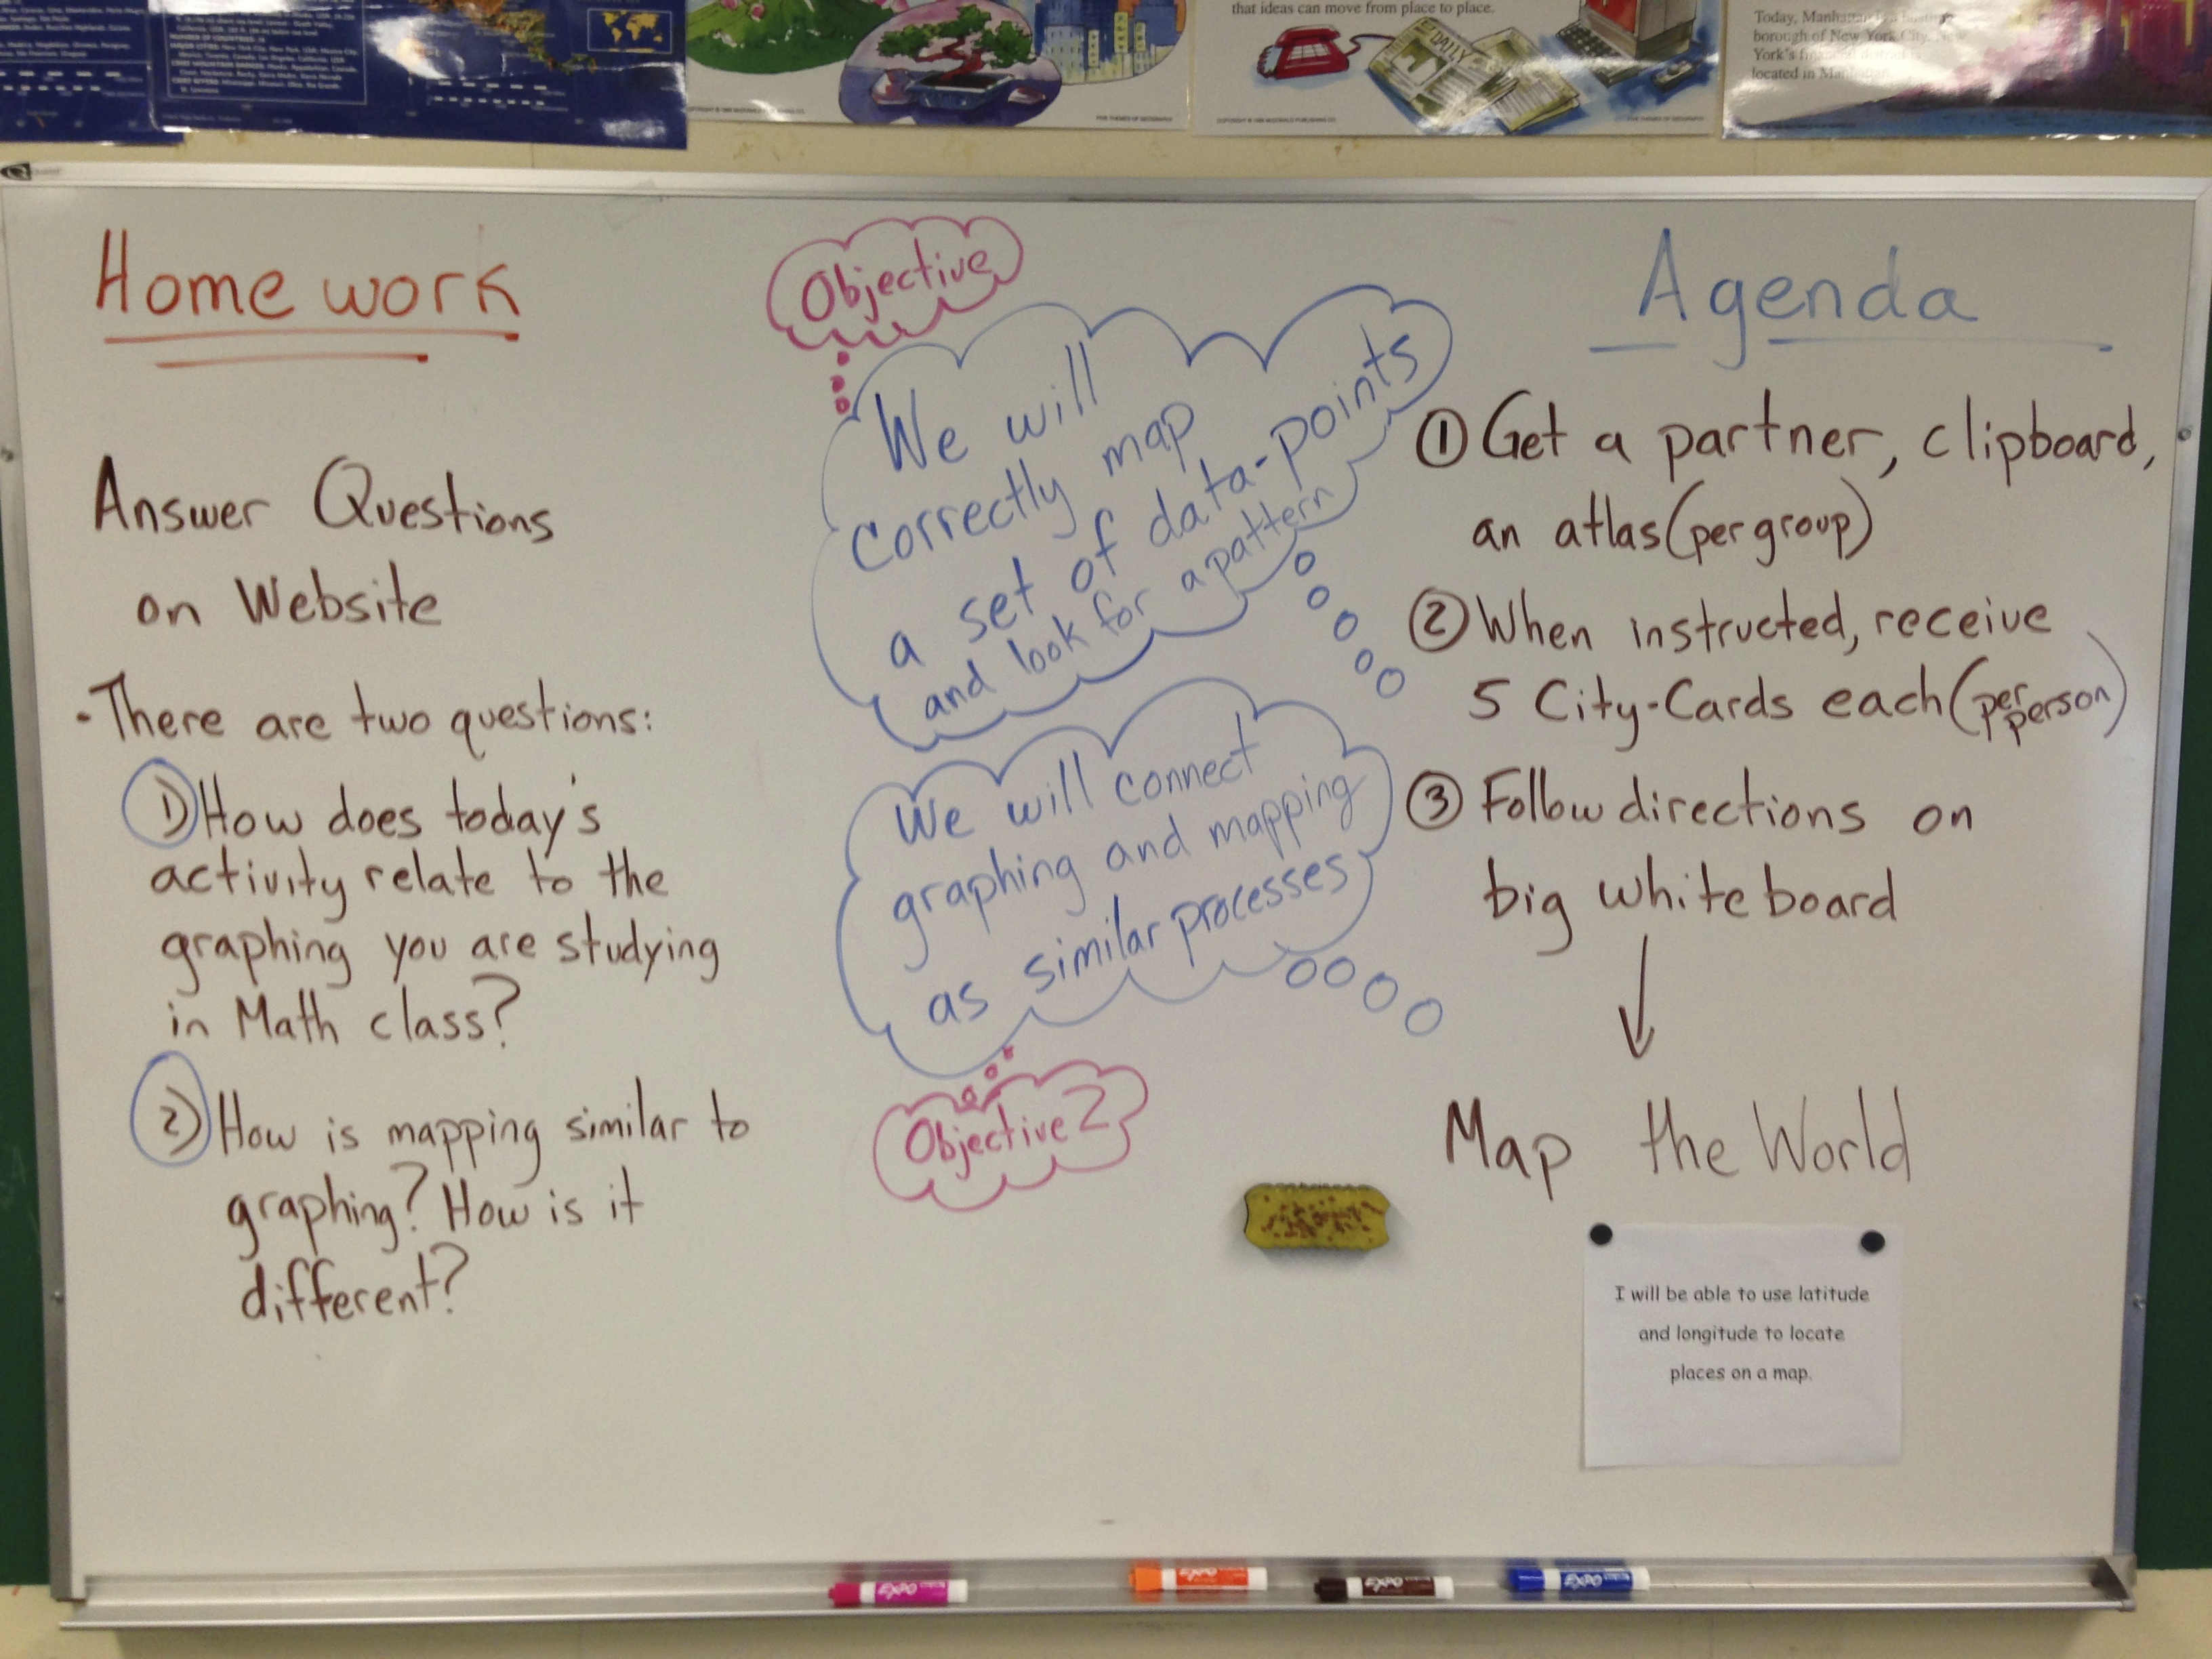
The objectives are:
- We will correctly map a set of data points and look for a pattern.
- We will connect graphing and mapping as similar processes.
I want my students to realize that the work they do in other classes (in this case learning about graphing in math class) has direct implications when studying the world around us. What is a map, you might ask? Is it a collection of data points on a grid? Yup. Basic math skills such as graphing are essential to understanding maps.
This activity is a chance for students to follow up on the practice they have done with latitude and longitude from the Koosh Game, illustrated in my previous post (check it out here) and extend that learning to how maps are made, why we need them, and how can they be useful to geographers.
Directions and Format
On the agenda board students are directed to the directions on the Big WhiteBoard. This is what they see.
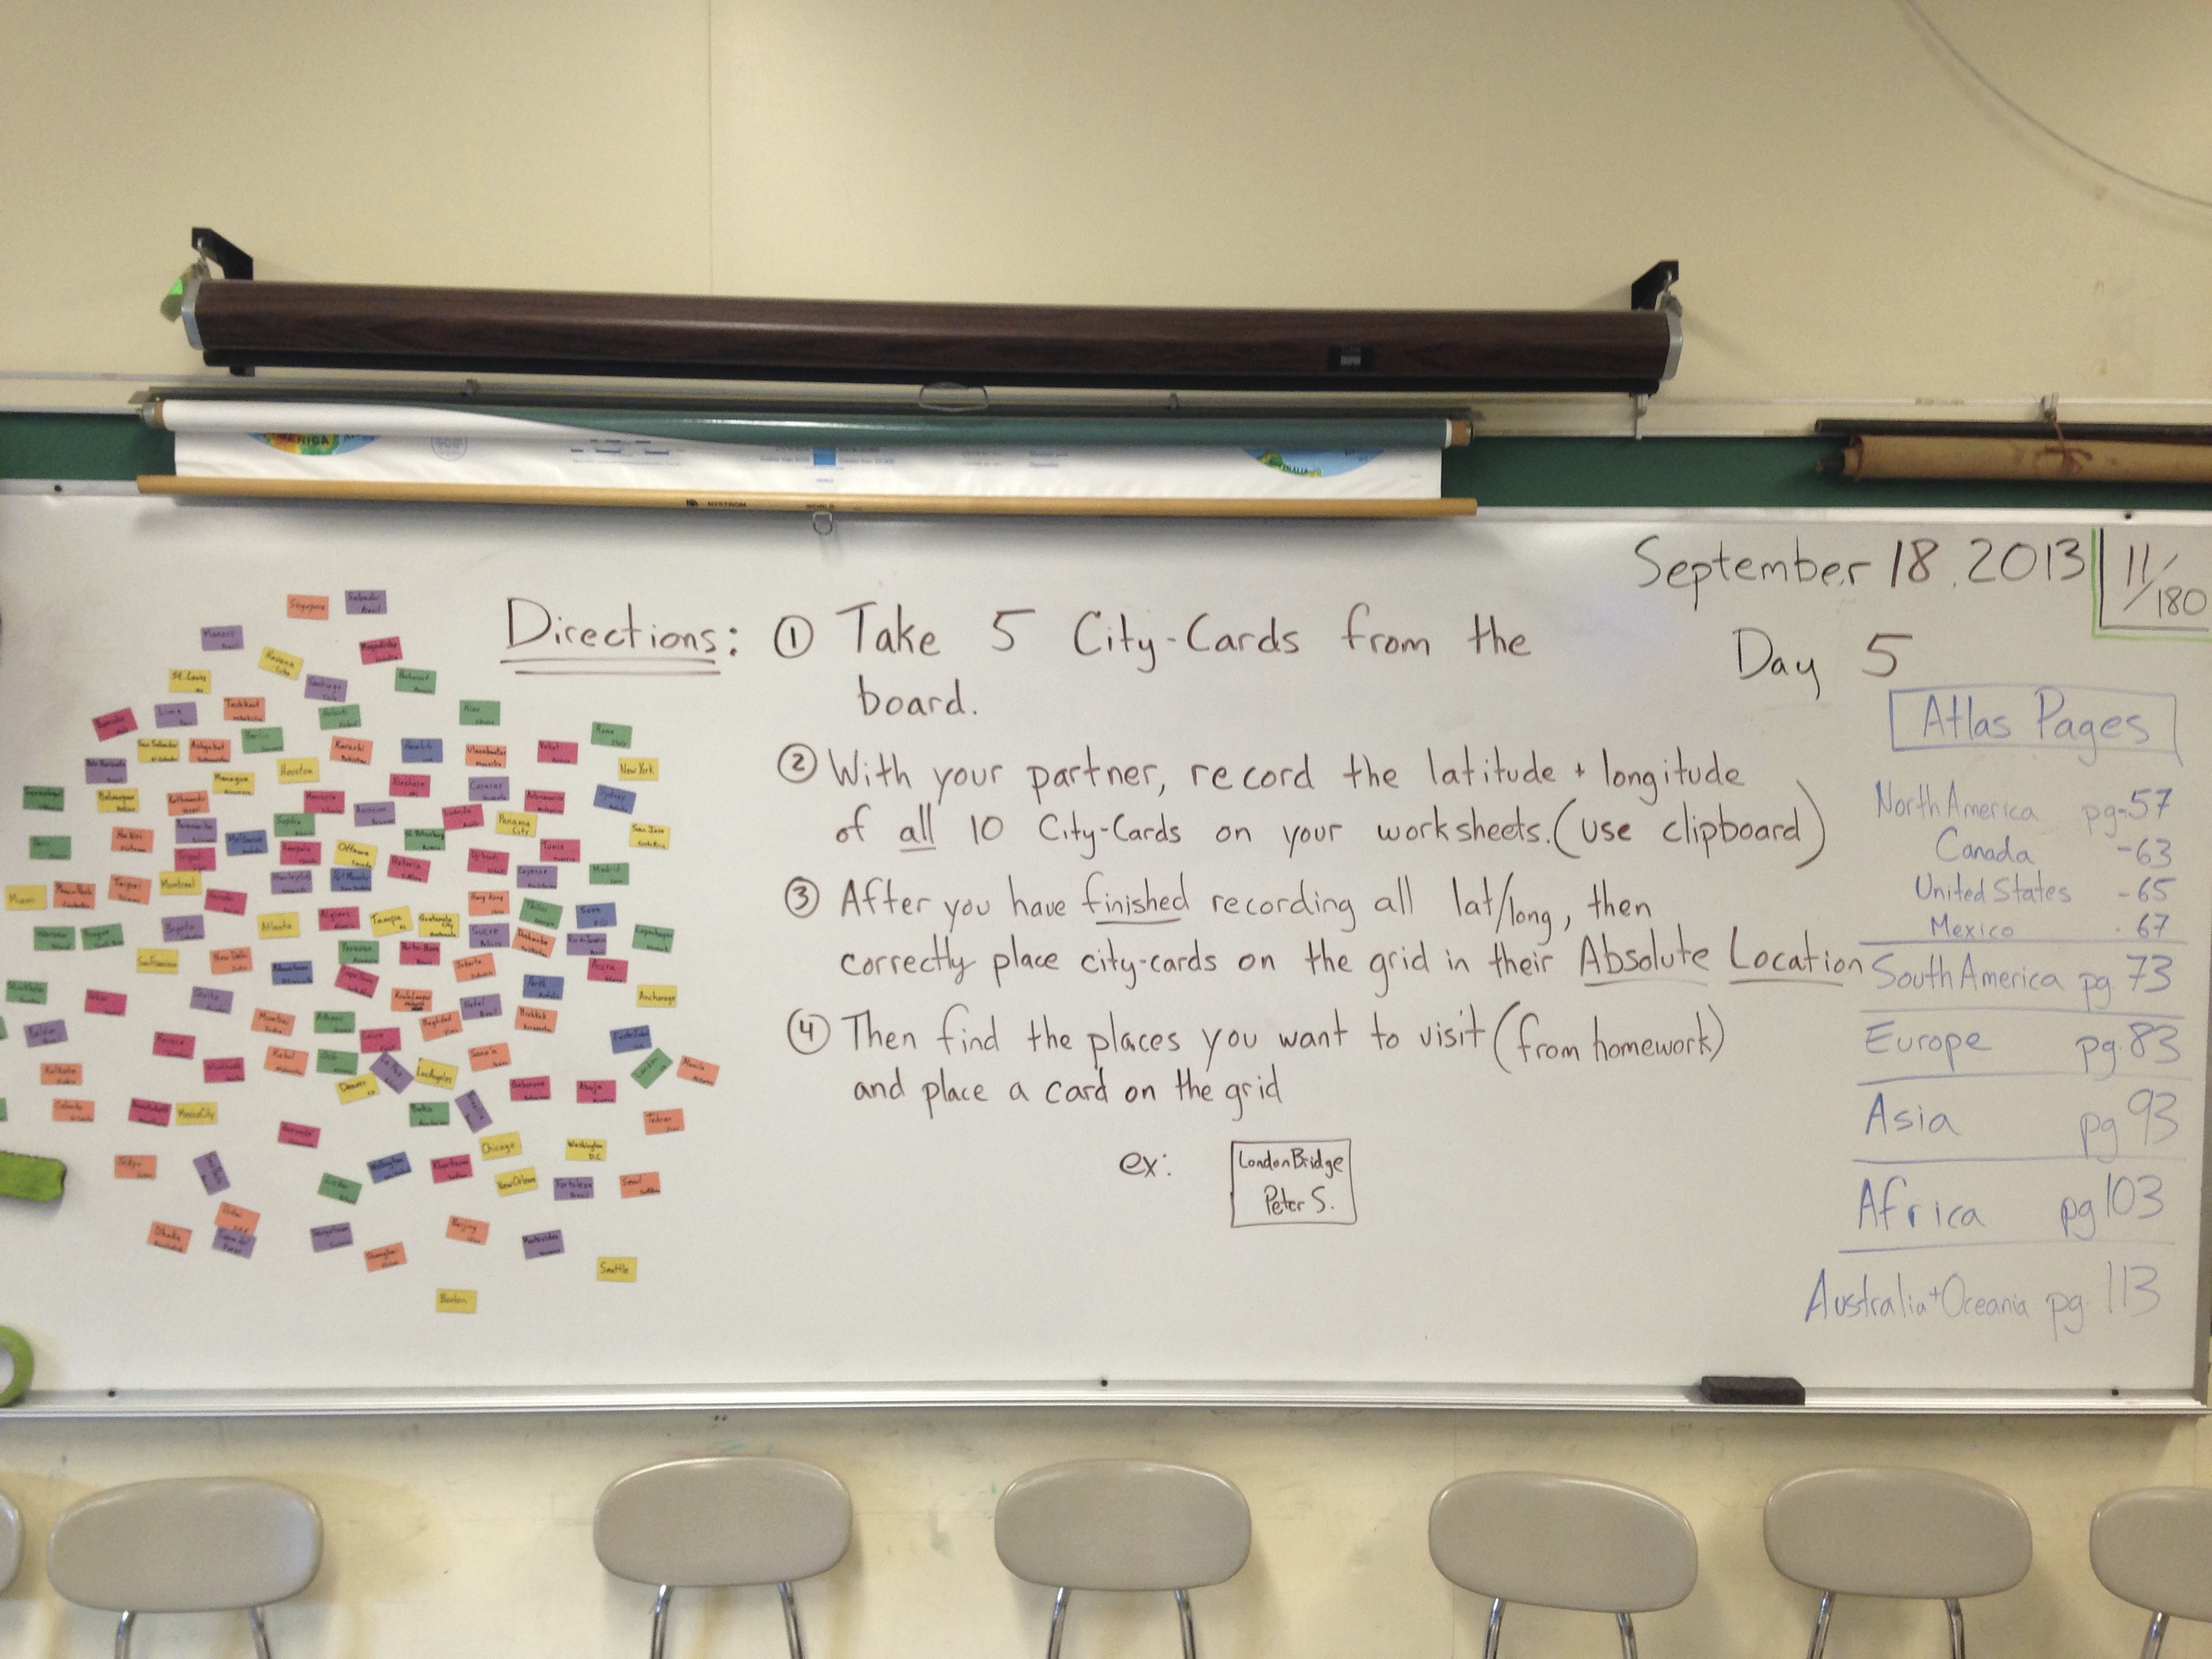
Each pair of students will take an atlas (if they want one) or they can use any globe, map or resource in the room. Altas pages for each continent are listed on the right side of the whiteboard for reference. The directions are simple.
- Each student will take 5 city cards from the board. Each pair of students will have 10 total cards
- With your partner, record the latitude and longitude of all 10 city-cards on your worksheet (use a clipboard)
- After you have finished recording all latitude and longitude, correctly place city-cards on The Grid in their absolute locations.
- Once finished, take an index card, find the absolute locations of your three locations from homework and place a card for each location on The Grid (this is an extension for student groups who finish faster than the rest of the class).
Here’s a close up of the city cards

Each card has the name of a city and the country that the city is located in written on it. Notice how each color represents a different continent? It helps students with my first objective of plotting data points and looking for a pattern. If a kid puts a blue card down in the middle of all the yellow ones they might recognize that this doesn’t fit the pattern. This is a cue to look back at a reference atlas, map, or globe to see where they might have made a mistake. Sometimes kids are so fixated on finishing the activity that they have an advanced case of tunnel vision. It’s so bad they don’t notice how far off they placed a card and only notice their error when they step back and see all the other colored cards are different from the one they put down. This is where I, as the lead learner, have to be aware of all students working and comfort level while they work. I have to monitor the room to catch them in the act of making the mistake so I can support and redirect or ask a leading question to set them back on the right path.
After 20-30 minutes of work I stop the class and ask everyone to move to the south pole of the room and observe what patterns, if any, they see emerging. If students have worked together as a team and finished all the cards, they will instantly see how the Grid has transformed into a map of the world.
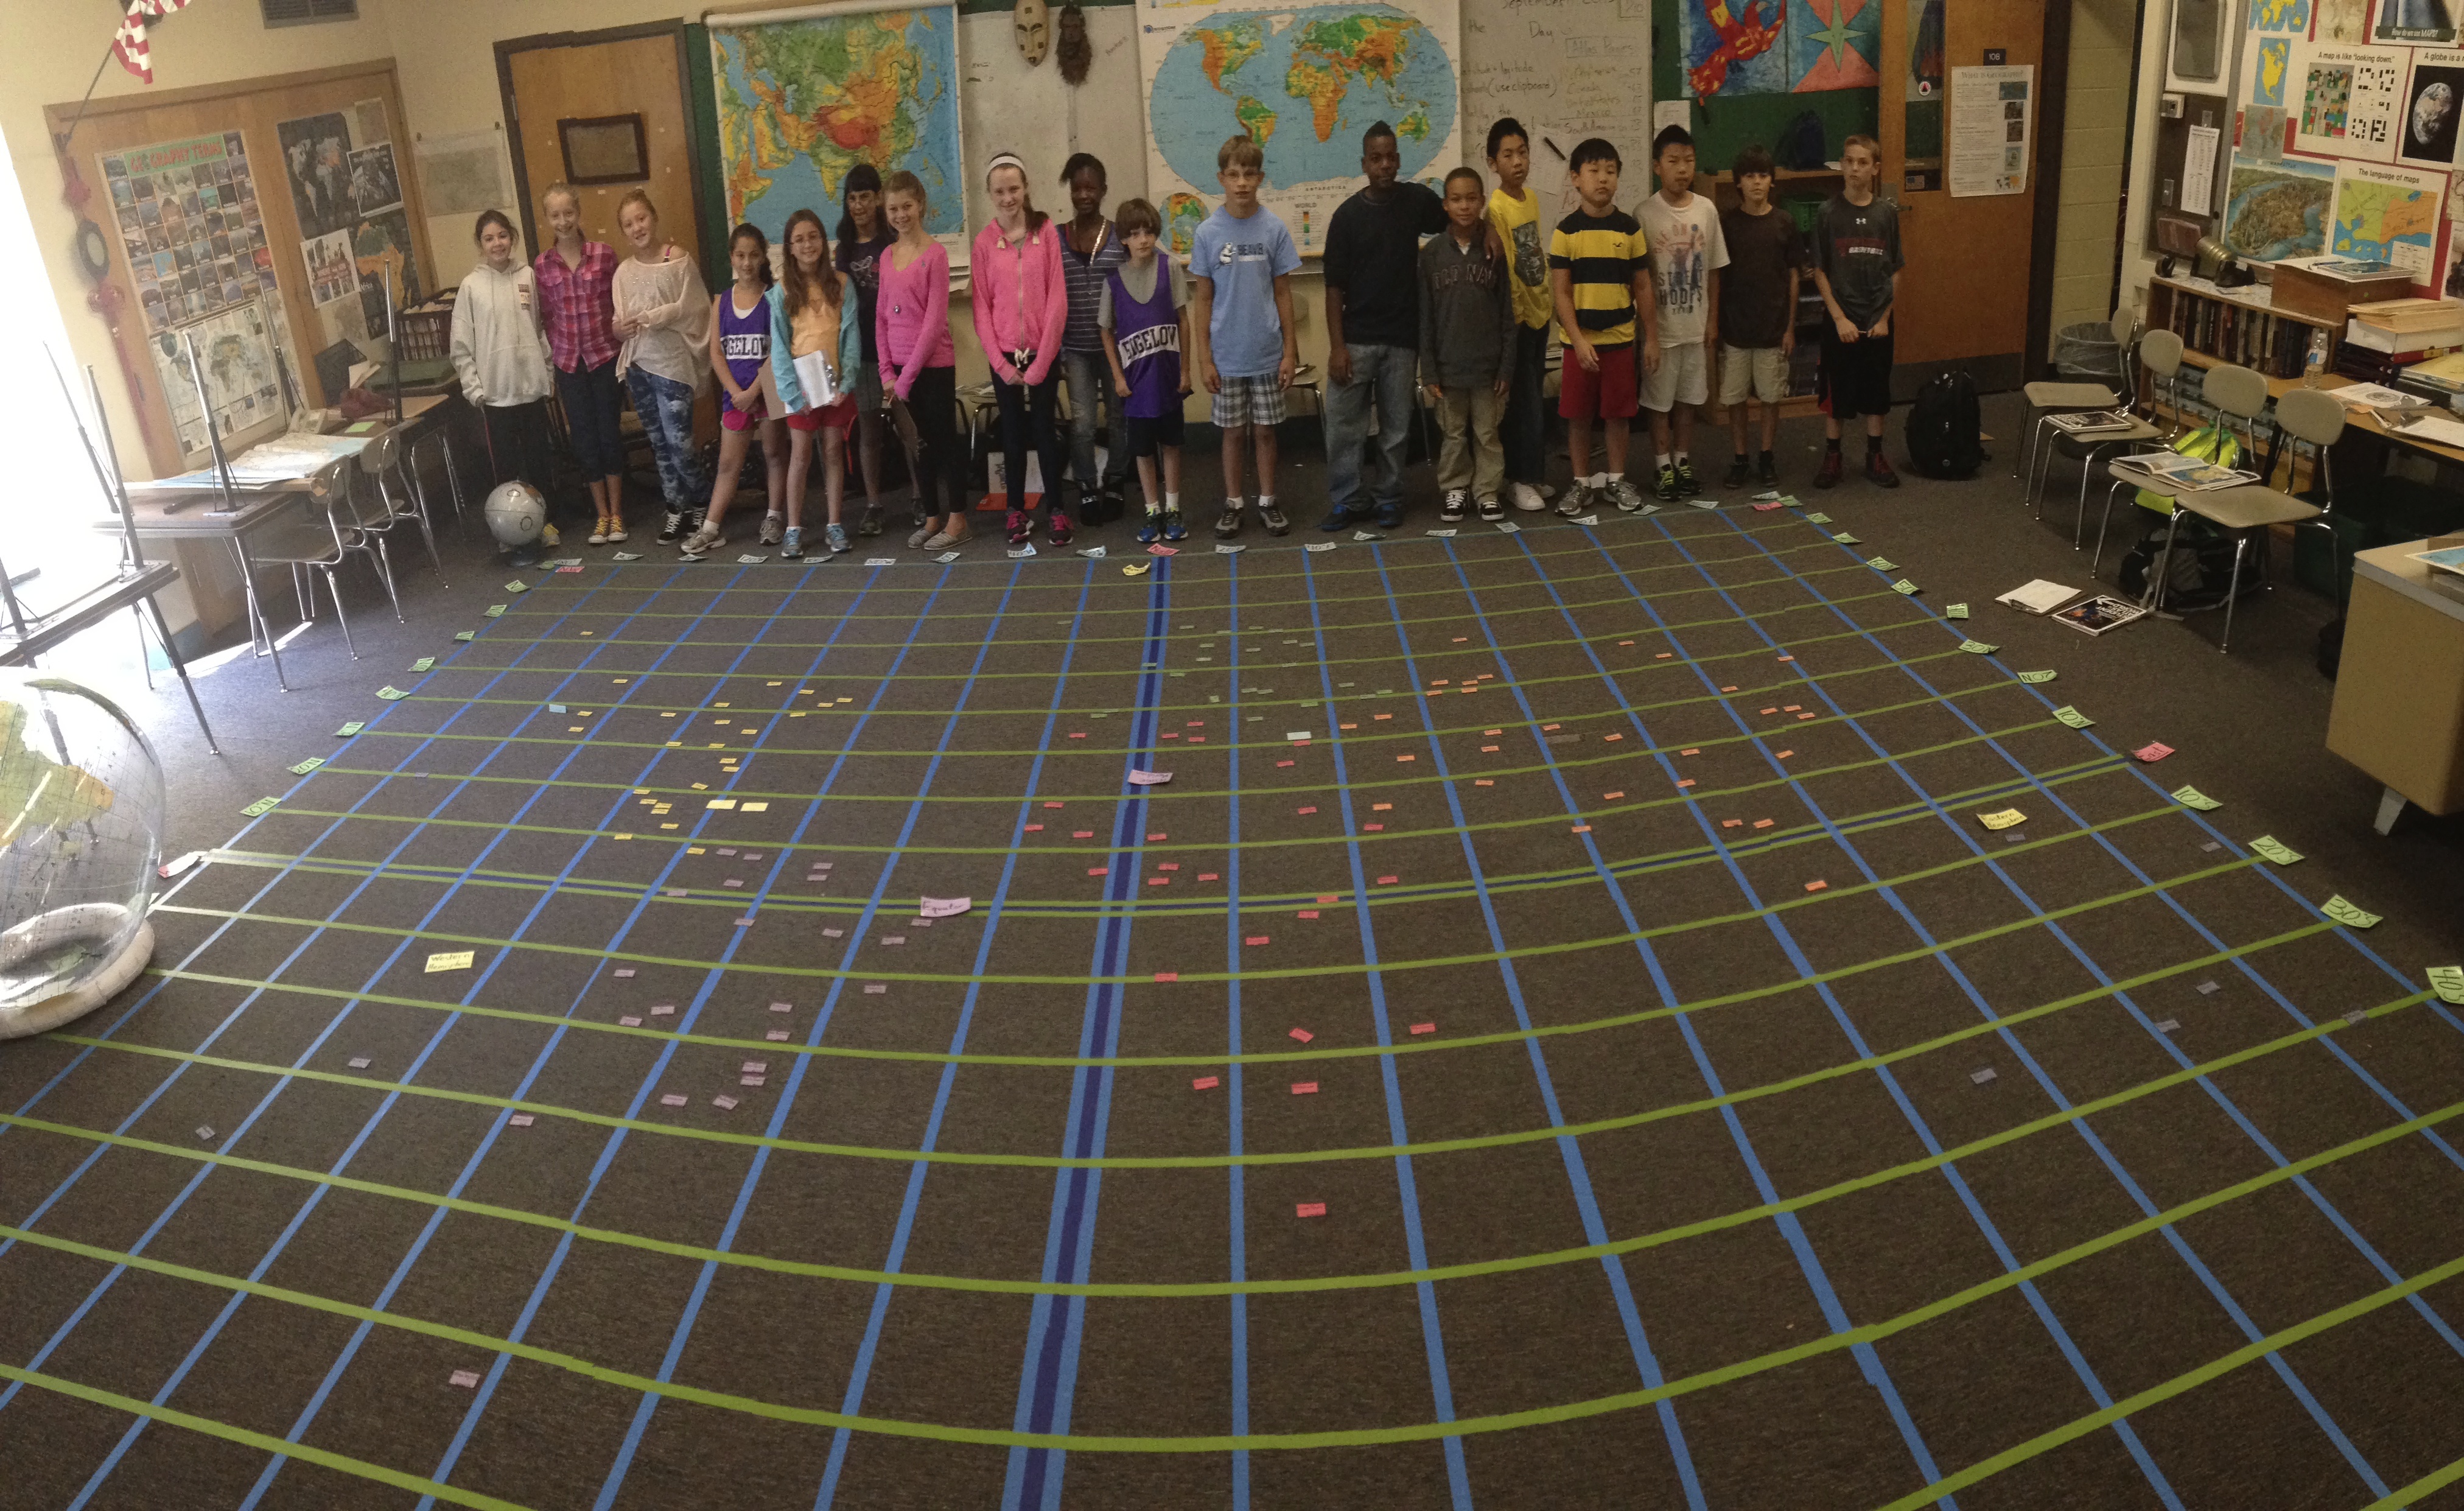
We talk for a while about the patterns that emerge. Some students notice that all the cards of each color are grouped together. Others might notice that there are no cards at the very top or bottom of the grid. The biggest observation is that the world has emerged from a bunch of points of data. This is what a map is. Just many data points charted on a grid. Some of the more insightful students will notice that many (most) of the cities seem to be located on the coast of the continent. They ask if that is where most of the people in the world live. I respond the only way I know how…
“That’s a great question! How do you think we might be able to find the answer to it?”
Always pleasantly unhelpful, I am.
This activity lends itself to many different conversations about the study of geography. Some of them, but not all, are:
- How are maps distorted? Students notice that the landforms on the map look a little bit squished. It give me an opportunity to discuss how maps are flat representations of the earth, which is a sphere.
- Why do people live near the coast? Most of the world’s population lives within 150 miles of the coast. Why is that? What resources might entice a population to stay close to shore?
- Why does the southern hemisphere get ignored so much? (actual student question) One of the patterns that emerge from this activity is the amount of land that differs from the northern to southern hemisphere. We might look at the most populated countries in the world (China/India) and note that they are in the northern hemisphere. It helps us answer the question “Why do people live where they do?”.
Watching students discover that they have unanswered questions about why the world is the way it is, is one of the single most rewarding moments I have as a geography teacher. Supporting students by creating a space where they WANT to learn is my single priority and goal when I teach. The Grid helps me establish the trust and respect, in a fun engaging way, from Day 1. My students know I am committed to providing a ‘judgment free zone’ for them to grow as lifelong learners.
When students are allowed to ‘own’ the space they learn in, allowed to walk to room and get out of their seat, learning emerges and is self evident.


2 thoughts on “The Grid Part IV: Build the World”